data-mining

Data mining

Data mining is the intricate process of filtering, sorting, and classifying data from vast datasets to uncover nuanced patterns and relationships. This analytical practice empowers enterprises to tackle complex business challenges through insightful data analysis. At its core, data mining forms a critical component of data science, leveraging advanced analytics to extract valuable insights from extensive data sets. Furthermore, it serves as a cornerstone in the Knowledge Discovery in Databases (KDD) process, facilitating the fundamental stages of data gathering, processing, and analysis.


In practical terms, data mining encompasses the utilization of sophisticated software tools and techniques to anticipate future market trends and facilitate informed decision-making within organizations. By employing cutting-edge data mining practices, enterprises can refine various facets of their operations, spanning customer-centric functions such as advertising, marketing, sales, customer support, finance, and HR management.
Data-Mining-Process

Moreover, data mining extends its influence to address pressing business needs such as cybersecurity planning, fraud detection, and risk management. Its applicability transcends industry boundaries, finding relevance in sectors ranging from healthcare and scientific research to sports and governmental projects.


Operationally, data mining is spearheaded by a multidisciplinary team comprising data scientists, seasoned BI professionals, analytical experts, business analysts, and tech-savvy executives with a profound affinity for data analytics. Leveraging machine learning, artificial intelligence, statistical analysis, and robust data management practices, these professionals navigate through key stages of the data mining process.

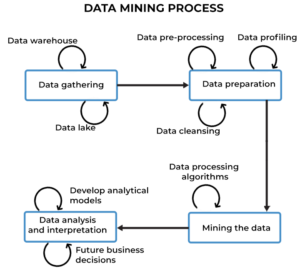
The data mining process unfolds through several pivotal stages:

Data Gathering: This initiates with the identification, collection, and organization of pertinent information from diverse sources, including data warehouses, data lakes, and other repositories housing structured or unstructured data.

Data Preparation: Subsequent to data gathering, meticulous fine-tuning of the collected data takes precedence. This phase involves rigorous data pre-processing, profiling, and cleansing activities to rectify any discrepancies and ensure data quality.

Mining the Data: With refined data at hand, data professionals proceed to select appropriate data mining techniques tailored to the specific context. This entails the identification of suitable data processing algorithms and initial training on sample data before application to the entire dataset.

Data Analysis and Interpretation: The culminating phase involves leveraging the insights gleaned from the mining process to develop analytical models that inform future business decisions. The data science team articulates these findings to stakeholders through intuitive data visualizations and other accessible communication channels, ensuring comprehension even among non-experts in the field.

Unveiling the Strategic Benefits of Data Mining for Enterprises

In the digital age, data mining emerges as a transformative tool for businesses, enabling them to navigate through vast volumes of data to unearth hidden patterns, relationships, and trends. This article elucidates the myriad advantages of data mining across various domains within enterprises, delineating its pivotal role in driving strategic decision-making and operational excellence.

Enhanced Customer Insights for Targeted Marketing

Data mining empowers marketing teams with profound insights into customer behavior and preferences, fostering the creation of targeted advertising campaigns. By discerning discerning patterns in consumer behavior, organizations can tailor their marketing efforts to resonate with specific customer segments, thereby enhancing engagement and conversion rates. Furthermore, data-driven sales strategies enable organizations to upsell and cross-sell products and services to existing customers, thereby maximizing revenue streams.

Proactive Customer Service Enhancement

In the realm of customer service, data mining serves as a powerful tool for tracking and analyzing customer interactions, whether through calls, online chats, or social media platforms. By leveraging data mining insights, organizations can proactively address customer issues and concerns, thereby enhancing overall service quality and fostering customer loyalty.

Optimized Supply Chain Management

Data mining enables enterprises to anticipate market trends and forecast future consumer demand, thereby facilitating effective supply chain management. By leveraging predictive analytics, organizations can optimize inventory levels, streamline logistics operations, and enhance overall supply chain efficiency. Furthermore, data-driven insights empower organizations to make informed decisions regarding product development, sourcing, and distribution, thereby gaining a competitive edge in the marketplace.

Predictive Maintenance for Enhanced Operational Efficiency

By harnessing data from sensors, IoT devices, and industrial equipment, organizations can implement predictive maintenance strategies to minimize downtime and maximize operational efficiency. Data mining algorithms enable organizations to identify potential equipment failures before they occur, thereby enabling proactive maintenance interventions and minimizing disruption to production processes.

Risk Mitigation and Financial Planning

Data mining serves as a critical tool for risk management, enabling organizations to identify and mitigate potential risks across various domains, including financial, legal, and cybersecurity. By analyzing historical data and identifying patterns of risk, organizations can develop proactive risk mitigation strategies and contingency plans, thereby safeguarding against potential threats to business continuity.

Streamlined Operations and Cost Optimization

Data mining enables organizations to identify inefficiencies and bottlenecks within their operations, thereby facilitating process optimization and cost reduction initiatives. By analyzing operational data, organizations can identify areas for improvement and implement targeted interventions to enhance efficiency and reduce costs. Furthermore, data-driven insights enable organizations to optimize resource allocation and streamline workflows, thereby maximizing productivity and profitability.

Empowering Data-Driven Decision-Making

In conclusion, data mining serves as a cornerstone of modern business intelligence, enabling organizations to extract actionable insights from vast volumes of data. By harnessing the power of data mining, organizations can gain a competitive edge in the marketplace, drive strategic decision-making, and unlock new opportunities for growth and innovation. As organizations continue to embrace data-driven approaches, data mining will play an increasingly pivotal role in shaping the future of business across industries.

Key Takeaways: Unveiling the Transformative Potential of Data Mining

In the realm of modern business, data mining serves as a beacon of innovation, offering companies a gateway to enhance their operational efficiency and bolster their bottom lines by uncovering invaluable patterns and trends within their vast repositories of business data. From retail giants to financial institutions, manufacturing conglomerates to healthcare providers, data mining techniques permeate every industry vertical, catalyzing strategic decision-making and driving sustainable growth.

Furthermore, with the advent of cutting-edge technologies such as machine learning and artificial intelligence, data mining has undergone a paradigm shift, evolving into a more automated, user-friendly, and cost-effective solution. This democratization of data mining tools has democratized access, rendering it accessible even to smaller organizations and businesses with limited resources.

As we gaze into the horizon of technological advancement, it becomes increasingly evident that the transformative impact of data mining transcends boundaries, permeating every facet of human endeavor. From optimizing travel expenses by identifying the cheapest airfare to New York City, to revolutionizing healthcare by uncovering novel treatments for previously incurable diseases, data mining stands poised at the forefront of innovation, poised to reshape the landscape of every field and application it touches.

BI & Data Visualization

BI & Data Visualization

Data visualization, much like dashboards, is an integral component of business intelligence (BI), serving as a means to effectively communicate and contextualize data. Through graphical representation, such as charts, graphs, maps, and plots, data visualization emphasizes significant changes, patterns, and trends, facilitating a deeper understanding of complex datasets.

The primary strength of data visualization lies in its ability to empower business users to interpret intricate data, draw meaningful conclusions, and make informed decisions rapidly. By presenting data in a visual format, users can identify correlations and insights that may not be readily apparent in static tables or text-based reports alone. Hence, selecting the right BI solution with robust data visualization capabilities is paramount.

In the context of BI, the objective is to transform data into actionable insights that support both operational and strategic goals, ultimately enhancing decision-making processes. To achieve this, organizations require self-service BI reporting capabilities integrated with data visualization tools, enabling users to effortlessly interpret and explore data without relying on technical expertise.

These tools play a crucial role in presenting key performance indicators (KPIs) and business metrics interactively, fostering a data-driven culture and facilitating faster decision-making. Moreover, data visualization tools are often complemented by data storytelling narratives, providing deeper context and meaning to the presented information.

Across various industries, including retail, finance, healthcare, and science, enterprises leverage BI solutions to dissect data and gain valuable insights into business performance and objectives. Data visualization tools serve as indispensable assets in this endeavor, enabling organizations to unlock the full potential of their data and drive informed decision-making.

In modern analytics solutions, there exists a plethora of data visualization options tailored to meet diverse business needs. From traditional chart types like bar and pie charts to innovative visualizations like treemaps and scatter plots, organizations have access to a wide range of visualization techniques to effectively communicate data insights.

For instance, Yellowfin offers a comprehensive suite of visualization options, including area charts, column charts, pie charts, and scatter plots, among others, to cater to varying analytical requirements. Selecting the appropriate visualization type is crucial to ensure data is communicated effectively, enabling end-users to interpret and act upon insights with clarity and precision.

Categories of Data Visualizations

Data visualizations today can generally be categorized into six distinct types:

1. Comparison: Allows for the comparison of metrics over time or across one or more dimensions.

2. Composition: Describes the composition or makeup of data, such as pie or bar charts.

3. Distribution: Illustrates how values are distributed by factors such as time or dimensional values.

4. Key Performance Indicators (KPIs): Highlights the current status of a specific metric.

5. Relationships: Shows the relationship between different metrics, often depicted through scatter plots.

6. Location: Displays data on maps, floor plans, or other spatial representations.

Selecting the appropriate type of data visualization depends on the specific requirements of the report or dashboard and the analytical needs of the end-user. Questions such as whether a relationship between metrics needs to be shown or if a comparison of two datasets is required should be considered before choosing a visualization method.

Some business intelligence (BI) solutions, like Yellowfin, offer assistance in selecting the most suitable chart category. For example, Yellowfin’s Autochart builder automatically chooses the best chart based on data selections, accompanied by a brief explanation of its intended purpose.

Best Practices for Data Visualization in BI Reporting

When designing visualizations for BI reporting, adhering to best practices is essential:

Define Your Audience: Keep the intended audience in mind to ensure that the visualization addresses their needs and motivates them to take action.

Maintain Consistency: Use consistent colors and fonts to draw attention to important data and maintain readability across visualizations.

Provide Context: Explain the significance of the data to your audience through data storytelling narratives, enhancing their understanding and encouraging action.

Use Formatting and Sorting: Organize data logically and simplify visual elements to aid interpretation.

Leverage Tables: Tables can complement visualizations, especially for dense data. Utilize features like sparklines and conditional formatting to enhance their impact.

Present Values Accurately: Ensure that data is represented accurately and effectively, avoiding unnecessary visual embellishments.

By following these best practices, organizations can create impactful and insightful data visualizations that drive informed decision-making in BI reporting.

Who Benefits from Data Visualization?

Data visualization serves a broad spectrum of professionals across various industries, aiming to simplify complex data and enhance comprehension. From retail to healthcare, finance to education, and beyond, organizations of every size and sector can harness the power of data visualization to drive informed decision-making and achieve strategic objectives.

Consider a sales manager in a media company striving to craft an engaging quarterly KPI report for executives or a finance executive utilizing visualizations to depict total investments. Regardless of the industry or role, data visualization plays a pivotal role in conveying insights effectively.

The Significance of Data Visualization in Business Intelligence

With an estimated 90% of information transmitted to the brain being visual and global data creation projected to surpass 180 zettabytes by 2025, the importance of data visualization in business intelligence (BI) cannot be overstated. In an era inundated with big data, businesses seek efficient means to decipher vast datasets and derive actionable insights.

Data visualization serves as a transformative tool, enabling organizations to navigate the complexities of modern data landscapes with ease. By presenting data in a visually appealing and interactive format, it empowers users to grasp insights effortlessly and make data-driven decisions confidently.

Humans are inherently drawn to visual stimuli, making data visualization an indispensable asset in BI initiatives. By offering a familiar and engaging interface, it facilitates widespread adoption of BI tools and encourages a culture of data-driven decision-making across enterprises.

In essence, data visualization serves as the cornerstone of modern analytics, empowering organizations to unlock the full potential of their data and drive strategic growth in an increasingly data-driven world.

I hope this captures the essence of your message effectively! Let me know if there are any further adjustments you’d like to make.

data-engineering

Data Engineering

Businesses generate vast amounts of data, encompassing everything from customer feedback to sales performance and stock prices, all of which significantly influence company operations. However, deciphering the narratives embedded within this data isn’t always straightforward or intuitive, prompting many businesses to turn to the field of data engineering.

What Is Data Engineering?

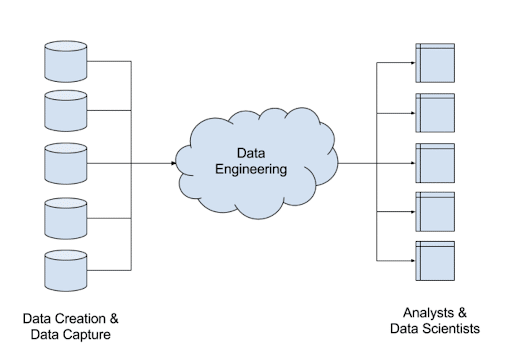
Data engineering encompasses the process of meticulously designing and constructing systems that facilitate the collection and analysis of raw data sourced from diverse formats and origins. These systems empower users to discern actionable insights from the data, thereby fostering business growth and innovation.

Why Is Data Engineering Important?

Companies, irrespective of their scale, are inundated with disparate data sets, necessitating thorough analysis to address pivotal business inquiries. Data engineering serves as a foundational pillar supporting this analytical endeavor, enabling data consumers such as analysts, data scientists, and executives to methodically, expeditiously, and securely navigate through the entirety of available data.

Data analysis presents challenges due to the heterogeneous nature of data management technologies and storage architectures. Complicating matters further, analytical tools often presume uniformity in data management and storage, posing significant obstacles for individuals seeking insights into business performance.

For instance, consider the diverse array of customer data collected by a brand:

  • Billing and shipping information are housed within one system.
  • Order history is managed separately.
  • Customer support interactions, behavioral data, and third-party information reside in distinct systems.

While collectively offering a comprehensive customer profile, these disparate data sets operate independently, rendering the resolution of specific inquiries—such as identifying order types associated with elevated customer support costs—exceedingly challenging.

Data engineering endeavors to bridge these data silos, facilitating seamless integration and enabling prompt and efficient access to insights.

What Do Data Engineers Do?

Data engineering is a skill that is increasingly in demand. Data engineers are tasked with designing systems that streamline data integration and facilitate navigation through complex datasets. Their roles encompass a variety of tasks, including:

Acquisition: Identifying and gathering diverse data sets scattered across the organization.

Cleansing: Identifying and rectifying errors within the data.

Conversion: Standardizing the format of all data to ensure consistency.

Disambiguation: Resolving any ambiguities in the interpretation of data.

Deduplication: Eliminating duplicate instances of data.

Following these processes, data is often stored in a central repository such as a data lake or data warehouse. Data engineers may also extract and transfer subsets of data to a data warehouse.

Why Does Data Need Processing through Data Engineering?

Data engineers play a pivotal role in designing, operating, and supporting the intricate environments that drive modern data analytics. Traditionally, data engineers meticulously structured data warehouse schemas, optimizing table structures and indexes to expedite query processing and ensure optimal performance. However, with the emergence of data lakes, data engineers now face the challenge of managing and delivering vast amounts of data to downstream consumers for analysis. Data stored in data lakes may lack structure and formatting, necessitating intervention from data engineers to unlock its value for the business.

Fortunately, once data sets have undergone comprehensive cleaning and formatting through data engineering, they become more accessible and interpretable. Given the constant influx of data generated by businesses, it is imperative to leverage software solutions capable of automating some of these processes.

The appropriate software stack can extract substantial insights and value from data, facilitating end-to-end data journeys known as “data pipelines.” As data traverses these pipelines, it may undergo multiple transformations, enrichments, and summarizations.

Data Engineering vs. Data Science

Data engineering and data science are complementary disciplines. Data engineers focus on ensuring data reliability and consistency for analysis, while data scientists leverage this prepared data for tasks such as machine learning, data exploration, and other analytical endeavors involving large datasets. Data scientists often rely on data engineers to locate and prepare data for their analysis.

Data Engineering with Larkinapp

Larkinapp streamlines data management for data engineers, providing a unified access point for all enterprise data for business intelligence and ad-hoc self-service analytics.